


Episode Overview
Project controls teams have never been bigger: scheduler, planner, controls manager, risk manager, sometimes a dedicated reporting manager. Ahmed Abdelfattah’s uncomfortable observation, from nearly 20 years across Egypt, Saudi Arabia and Australia, is that the process has become less efficient than when one planner ran a project with Primavera P3. The episode is his diagnosis (a discipline that started serving its own process instead of the project) and a field guide to reversing it: risk analysis from day zero, reports built around a single decision, and dashboards designed like roadside billboards. In the companion episode he shares his screen and walks through eleven of the dashboards that made his name.
The efficiency inversion
“The project control process has become less efficient than in the past.” One planner with P3 had a direct line to the project manager’s decision. A five-role department now perfects its own output: “a separate business other than the project management itself.”
Cairo → Riyadh → Adelaide
A first job on a roughly $200M Arab Contractors project, more than a decade on Saudi mega programs with Egis, AECOM (NEOM) and EllisDon, and now advisory work for engineering and design teams from Adelaide. His LinkedIn dashboards are how Orion found him.
The dashboard tour
A 31-minute video companion: advice for students and early-career controls engineers, then a screen share of eleven of his dashboards, the design principle behind each, and the portfolio view that “gathers most of my philosophy.”
A written companion to the released episode and its companion video. Quotes are transcribed from the published audio and lightly condensed for readability (false starts and fillers removed, meaning untouched); timestamps link to the moment on YouTube and are approximate, and companion times are marked. The dashboards in the tour are Ahmed’s own published work, captured from the companion episode’s screen share. Biographical details come from Ahmed’s public profile and the on-air introduction. Ahmed speaks in a personal capacity, not for any employer or client. Photos: Giza, Riyadh and Adelaide, the three stops of his career, under Creative Commons licenses; full credits at the end.
Inside the Episode
The main episode follows the show’s four-act arc: Ahmed’s road in and the efficiency-inversion thesis; the diagnosis (a $2B project’s integrated system that nobody used, NEOM’s silos, the gap between report and field); the method (risk from day zero, two kinds of reports, the billboard hero); and a close on minimum viable controls, the SPI reframe and the Khufu question. The companion video carries the advice round and the dashboard tour. The strip maps each chapter’s share of the 1h 10m; timestamps are approximate. Click any block to jump to its chapter.
“We only produce reports. And that is what we are paid for.” An early manager, quoted at 6:12 and “Risk is not visualized. Risk turns into a decision.” 33:06
The method chapters carry the weight: day-zero risk, the two kinds of reports and the entropy story run nearly half the episode.
The Efficiency Inversion
His road into nine-digit projects, and the thesis: one planner with P3 versus a five-role department that got less efficient as it grew.
“We Only Produce Reports”
The manager line that defines the job, the COVID-era LinkedIn dashboards, and the integrated system on a $2B project that nobody used in the executive meeting.
Scenarios, Silos & the Site
Executive, scenario and focus reports; why a report that misses the site is useless; NEOM’s 500-person team and the silos it bred.
Day Zero: Risk Before Everything
His day-zero install is a risk tool, not a scheduler. The 40-plus-story schedule that promised lighting fixtures on floor 26, two years out.
Two Reports, One Hero
Records versus decision reports, the reader’s insecurities, the billboard hero, and why executives trust the person, not the dashboard.
Entropy: When the Process Outruns the Site
A two-hour site fix that takes a week through the document system, the 60 pages nobody reads, and the line between rigor and bureaucracy.
Minimum Viable Controls & the Khufu Question
A three-month look-ahead written with the site team, the SPI reframe that changes a meeting without changing a fact, AI, and the pyramids.
The Dashboard Tour & the Advice Round
Released as its own video: advice for students and year-one controls engineers, then Ahmed shares his screen and walks through eleven of his dashboards, oldest to newest.
Each block links to its chapter below: the map mirrors how the released episode flows.
The Guest · Ahmed Abdelfattah

Ahmed has spent nearly 20 years in project controls across three countries. He started in planning and scheduling in Cairo with the Arab Contractors, “an official sponsor of the Egyptian government projects in infrastructure,” moved to EHAF Consulting Engineers, then spent eight years with Egis on Saudi mega programs, a 2021 stint with AECOM on NEOM, and nearly four years as project control and risk manager with EllisDon in Riyadh. Since 2022 he has advised engineering and design teams on planning, risk and delivery through Chartenia, now from Adelaide. If a clean project-controls dashboard has crossed your LinkedIn feed, there is a good chance it was his: that is how Orion found him.
“Learn about tools to get a job, but learn about the project to be special in your field.”Ahmed Abdelfattah · companion · 1:21
Career journey
On the record
- First project
- Around $200M, with the Arab Contractors: “From that point, it was easy for my CV to attract positions that require a person who can deal with a project with a nine-digit budget.” 1:20
- Saudi programs
- Two roughly $2B programs, one private and one governmental, the second wired end to end with Oracle Aconex, Primavera EPPM and Power BI. 10:33
- NEOM
- With AECOM in 2021: a program management team of about 500 people, on one of more than 12 programs. 21:47
- The dashboards
- Started during COVID job uncertainty; the calls that came back were “not only from recruiters but from vice presidents, directors and portfolio managers.” 7:09
Credentials & links
- Education
- B.Sc. Civil Engineering, Benha University.
- Certifications
- Project Management Professional (PMP); PMI Scheduling Professional (PMI-SP).
- His work
- ahmed-fattah.com · templates, dashboards and a blog where he writes about the industry “differently than many people do.” companion · 29:23
- Find him
- LinkedIn: /in/ahmed-abdelfattah-3b44399b · every dashboard in the tour is on his feed.
The Host · Orion Matthews

Orion is an award-winning programmer, entrepreneur and technology executive who has spent the last decade in the engine room of major capital projects. He founded Queryon in Washington, D.C. in 2015 with a focus on data analytics and software for the construction industry, starting with bellwether client BP, whose project-controls solutions his team deployed globally, from the North Sea to Azerbaijan to Houston. Today he’s a recognized expert in PMO data analytics and project-controls reporting, serving billion-dollar portfolios for owners including BP, Santos, Balfour Beatty and Turner & Townsend, a regular speaker at major industry conferences on AI and analytics in capital projects, and the host of this show.
Why this pairing works
- Same craft, two ends
- Orion builds the reporting systems capital portfolios run on; Ahmed argues the system matters less than the person presenting from it. The integrated stack nobody used in the executive meeting is the story they keep circling.
- The dashboard thread
- Orion found Ahmed through his LinkedIn dashboards, and both land on design as credibility: Orion’s point about a stray period on a board paper and Ahmed’s billboard hero are the same rule from two sides.
Beyond the PMO
- The builder’s arc
- Founded Introspect Software out of high school; built and sold Design-PT (acquired 2015). His software has run from McMurdo Station to aircraft carriers, with write-ups in Scientific American, CNN and Maxim, and a BP Helios Award.
The Efficiency Inversion
Orion opens with the on-air introduction: nearly 20 years in project controls across three continents, a decade-plus on Saudi mega programs, now advising from Adelaide. Asked what changes as you cross regions, Ahmed refuses the premise. The variable that matters is the era: his 2008 Cairo projects ran on one planner and Primavera P3, today’s on a five-role department, and in his observation the process got less efficient as it grew.
“Let’s say that I was a bit lucky, because my first job was with a major contractor in Egypt and Africa, the Arab Contractors… I remember the first project I worked on was worth around 200 million USD. From that point, it was easy for my CV to attract positions that require a person who can deal with a project with a nine-digit budget.”Ahmed Abdelfattah · 1:20
“I cannot compare my work in Egypt during 2008 to 2010, where each project was allocating only one planner with a tool like Primavera P3, to the current setup of project controls: the scheduler, planner, project control manager and risk manager, and sometimes a reporting manager. It’s like comparing one apple to ten apples, but my observation is that the project control process has become less efficient than in the past.”Ahmed Abdelfattah · 3:46
Why: the process turned inward
The old setup: “One planner or one project control manager, one guy who’s doing it, or maybe two. They are more focused to process what the team needs, in support of the team. You have a direct contact between the project control manager and the planner with the project manager directly and his decision.” The department broke that line.
A separate business
“What does the department of project control management do in a project? They are processing to improve the project management process… So more like now we are working in a separate business other than the project management itself.”
- “From that point, I became like a major project guy”: the Arab Contractors project that made his CV a magnet for nine-digit work. 1:59
- The global trend he sees: “serious attempts to automate the input and output itself, and even the final decision.” 2:43
- Why it’s less efficient: “Now we are focusing more on the process itself.” 4:27
- “We are now competing ourselves to be the best in this discipline… rather than working to achieve the project completion date.” 5:13
“We Only Produce Reports”
The dashboards that made Ahmed visible have an origin story: a manager’s blunt reframe of what a project controls team actually sells, delivered nearly twenty years ago and never forgotten. Then the chapter’s centerpiece: two roughly $2B Saudi programs, the governmental one wired end to end with the most advanced stack money could buy, and an executive meeting where nobody used it.
“Ahmed, we are part of a project team. We are not producing shop drawings. We are not producing a design paper, or supplying construction material, or even building something on the site… We only produce reports. And that is what we are paid for. Our clients are paying us for these reports.”Ahmed Abdelfattah, quoting an early manager at the Arab Contractors · 6:12
“They hired Oracle with Aconex, and they got Primavera EPPM, and made a link between Primavera EPPM and Power BI… When we are making decisions, no one was using this system. In executive meetings, they would say, “Please, Ahmed, can you prepare for us one report to tell us about it, one, two, three?””Ahmed Abdelfattah · 10:48
The slide stack
“Most project control managers do a very basic thing. They let each team (procurement, site management, design) prepare their own slides or reports and then stack them in a single PowerPoint or PDF and throw it to the client. ‘Here it is.’” And you can expect information contradicting itself.
The tool becomes a mailbox
“After one or two months this tool turns out it’s just like a communication tool. We are using this tool just to communicate between each other… We’ll send email by this tool. It’s not for the schedule update. It’s not to gather information for procurement.”
- COVID job uncertainty, and the basic dashboards he started posting on LinkedIn. 6:37
- “I received so many calls, not only from recruiters but from vice presidents, directors and portfolio managers.” 7:09
- Who reads the report? “The report should go to the counterpart, whether the counterpart is the client or the higher consultant.” 8:10
- “You have spent a million dollars or something on this system. So what’s the benefit of it, and why do you ask me to organize this chaos?” 11:33
- His conclusion: “It’s still the human factor that is needed in the construction environment… It depends on trust and human interaction.” 12:04
- Orion’s owner-side echo: eight systems, twelve contractors, and nobody deletes any of them to fit one PMIS. 12:34
Scenarios, Silos & the Site
What executives actually read, and what the field actually does. Classic daily, weekly and monthly reports get no attention; executive, scenario and focus reports get all of it, because they help make a decision. Then the gap between report and site, why government projects tolerate it, and the biggest data point in the efficiency-inversion case: a NEOM program whose management team alone ran to about 500 people.
“No one gives any attention to classic reports: the daily, weekly, and monthly reports. Instead, they are more interested in executive reports, scenario reports, and focus reports. The common thing among all of these special reports is that they help in making a decision, not only showing information.”Ahmed Abdelfattah · 14:10
“You put both scenarios in a dashboard, on a report or something like that. You put them in the same scene and boom, all is clear. You don’t need a lot to explain. Just visualize it.”Ahmed Abdelfattah · 16:02
Government versus private
“In governmental projects, they lean more to the outputs of the process… simply because of the audits.” In the private sector there is more tolerance to deviate from the process, or drop it with the client’s agreement: “This is the output I can promise you.”
When one director took it back
“We reached a point where the director from the client side stepped forward and said, ‘Enough is enough. Direction only will come from me. Anyone who needs to do any change must come to me first.’” Team against team had stalled the project; in some situations, he says, “we need that.”
“I worked in NEOM, the new development in Saudi Arabia, and our management team was like 500 persons… This only was for one project, or let’s say one program, because at the time there were more than 12 programs with AECOM. And I realized that no one cares about the project completion rather than his own work.”Ahmed Abdelfattah · 22:27
- What keeps executives listening: “when you visualize the root cause of any issue or a challenge.” 14:44
- What loses them: justifying the numbers. “Ahmed, can you please skip over this, and let’s make a technical decision for it later on.” 15:11
- The school he came from: “If your report or schedule is not reflecting the site condition, then it is useless.” 17:06
- Orion’s deck of cards: 52 cards never shuffle the same way twice, and a mega project has more than 52 people and systems. 20:06
- The smaller team, for scale: on his last projects with EllisDon, a direct management team of about 25, plus 10 commercial and 40 in supervision and engineering management. 21:16
- Orion: “You may have worked on the largest project I’ve ever heard of, with a 500-person project team.” 22:58
- What executives want on the table: “Just put the risk issues and required decisions, and you will find them 100% listening to you.” 25:01
Day Zero: Risk Before Everything
Orion’s hypothetical: same team, same budget, stand up project controls from scratch tomorrow. What gets installed first? Ahmed’s answer takes one word, and it is not a scheduling tool. The chapter builds to the best story of the episode: a 40-plus-story tower schedule whose final activity was a promise nobody could keep.
“One word. Risk analysis tool. You have to involve risk from day zero, not from day one… 90% of my time is just preparing scenarios for the decision-makers to make decisions. Nothing can do better than a risk analysis tool.”Ahmed Abdelfattah · 25:51
“How sure am I that on January 1 there will be 60 people coming to the building, which is not built yet, to floor 26, which is not there yet, to install lighting fixtures which are not selected yet, and not manufactured yet, and it will be completed in the same day? It should happen two years from now.”Ahmed Abdelfattah · 30:31
The floor-26 epiphany
He built the schedule “like the handbook of planning.” His manager asked for the completion date (January 1, 2023, last activity: lighting fixtures on floor 26) and said, “Great, you are perfect. Now let’s go to our client.” Preparing the submission, Ahmed caught himself: the certainty was fiction. What the client deserved was a probability.
The conclusion he built on it
“Risk management is the essence, the basic foundation of planning. If there is planning without risk management, it is nothing. We are just doing process.” And the same rule for every decision: “When you are talking about a decision, there should be risk analysis for that.”
“Risk is not visualized. Risk turns into a decision. There is nothing called “I can show you how many risks are closed, how many risks are open.” What is the benefit of that for a decision maker?”Ahmed Abdelfattah · 33:06
- If he could go back: “I would install Primavera Risk Analysis or any other software like it,” tools most controls managers still don’t know how to use. 26:41
- Orion: even on billion-dollar projects, “risk is often managed on Excel.” 27:20
- “I’ve been known for being a dashboard guy on LinkedIn, but now I love to work on risk.” 27:51
- “It’s not enough just to say high risk, low risk, green light, yellow light.” 28:24
- How to answer a client’s “crazy idea”: simulate it. “If you do that, you will find this. At 80% confidence, you need to do that.” 33:51
Two Reports, One Hero
The chapter that untangles the report question. Every project produces two fundamentally different documents that happen to share the word “report”: one is a contractual record, the other an instrument for moving a decision. Then Orion asks what makes a report decision-grade, and Ahmed answers with fast food, and with the uncomfortable truth about why executives accept the number at all.
“First type: reports which record the responsibility and causes, the contract record. These come in plain systematic documents such as monthly and weekly reports… Maybe we can rename them: instead of “monthly reports,” we can say “monthly record” or “weekly record.””Ahmed Abdelfattah · 36:47
“These kinds of reports do not need a systematic approach. There is no template. Template does not work with this. AI or any management tool will struggle to find a place, because this is built on how the other person will perceive the information.”Ahmed Abdelfattah, on executive, scenario and focus reports · 37:36
Know the person first
“You need to understand the person you are reporting to. You need to know his time limitation, his purpose, his background, and even his insecurities. Then you need to specify the purpose of the decision you need from this report. Then you need to develop the report as a story.”
Why the stakes are so high
“Imagine that a project director is holding a decision over one or two billion dollars. He’s acting literally like a CEO. He’s not a project director anymore… He needs a team to secure his decision.”
“Imagine you are driving on the street. You have five seconds only to make a decision. You will find a big poster showing a huge good-looking sandwich, with a price tag with a big font… You know the target, which is the sandwich, and the decision, which is the price.”Ahmed Abdelfattah · 41:49
“Your hero: the issue in the focus. Then comes the decision you need to make. Other details may be important to show, but they should become a sub.”Ahmed Abdelfattah · 42:45
The doctor and the X-ray
“A person has cancer, God forbid… The doctor said, ‘I read your X-ray pictures and tests, and we have to cut out this organ.’ Does this person doubt the doctor’s decision? Maybe he will take a second opinion, but he never tries to understand the data in the X-ray himself.”
What trust buys the reporter
“They will not ask why the SPI is 0.8 this month. They will not ask, ‘Did you review the schedule? Did you make the correct update?’ They will just come to the conclusion, because they will trust your judgment.”
- Orion’s recap: a standard flywheel of records, and dynamic reports triggered by a human trying to understand something. 39:08
- “What I need is decision-driven reports. And you cannot make a single template for all the decisions.” 40:14
- Orion pushes back: “Do I trust that the burger is going to be tasty?” 43:15
- The answer: “By trusting the person who speaks… executives make their decisions based on their trust in the person who gathered the data.” 43:34
- Orion’s board-level corollary: a stray period on a document signals that whoever prepared it was scrambling, which is why design is part of credibility. 46:53
Entropy: When the Process Outruns the Site
The chapter that will make site engineers nod hardest. Drift starts early and invisibly, because the site team and the management team live in two different worlds. A problem that once took a walk across the site and a signature now takes a week-long round trip through the document system, and when the project slips, the post-mortem blames everything except the system.
“In regular old fashion, he would go directly to the engineering consultant with the drawing and calculation and get approval, or sort out the issue immediately. How much would that take? Maybe one, two hours, maybe maximum one day… How much do we take just to communicate the information? At least three days. And the same amount of time will be consumed in returning the information to the contractor site.”Ahmed Abdelfattah · 48:58
A column dimension problem the site engineer could once settle in an hour or two with the engineering consultant, routed through the management system instead.
3 days backfor a fix that took hours
“We say the project is delayed because of a lack of resources or bad performance or unqualified engineering staff, but we never say insufficient management system. The process is perfect, the routine will advance quality, but it kills the purpose of the project management itself.”Ahmed Abdelfattah · 51:12
The 60 pages nobody reads
Orion: “Every major project has 60 pages of information that nobody reads. Does it deserve to die or just need a different style?” Ahmed: “It’s true that nobody reads it, but it’s still important… We can call them not reports. We can call them project records.” Systematic, so this month compares to the last.
Rear-view mirror or windshield
Site operation teams review the past: challenges, performance, achievements. Executives “usually prefer to see a brief about past performance, but they’re more into future insights that help to make a decision,” which is why his reports lead with scenarios, risk and forecast.
“I am happy to do so, but I am afraid I’m not willing to spend the rest of my life in jail.”Ahmed Abdelfattah, quoting a project director he worked with · 56:43
- “Site team and management team are living completely in two different worlds.” 48:34
- While the paperwork loops: “How will the site team feel? How will the supervisor think? How are the carpenter and the steel fixer?” 50:41
- Orion: data speed and flow is the missing piece; it can be measured, and the industry mostly ignores it. 51:40
- Rigor versus bureaucracy: “There is no big difference between a CEO and a major project director,” and a bold director still cannot supersede the audit. 55:49
- His ask: “We need to make, like, a revolution in our vision of how to manage this kind of project. The current system is not enough.” 57:09
Minimum Viable Controls & the Khufu Question
Asked for his minimum viable control setup, Ahmed starts with the plan itself, and a heresy: the multi-year, fully detailed schedule is an illusion. A realistic plan details three months ahead, is written as a translation of the site team’s intent, and lives in a system the main contractor owns. Then a masterclass in narrative, the AI question, and a closing challenge aimed at every tool in the stack, with the Great Pyramid as the exhibit.
“This is illusion. A detailed plan shouldn’t exceed a three-month look-ahead… Second thing, the plan should be a translation of the project team. Site team are the most involved, not something invented by the planner or the project control manager.”Ahmed Abdelfattah · 58:03
“Assume you are in a war. There are soldiers on the field, and there are leaders and command in the offices. The soldiers are already suffering. He is injured. Maybe some soldiers die. But the leaders say, “Ah, we are winning here.” So which one should I believe?”Ahmed Abdelfattah · 59:55
Who we believe today
“The most sarcasm comes here when we don’t say the schedule is not realistic. We say the site team is delayed… In the current setup, we are believing and trusting the planner, not the site.”
The contractor should own the system
“The one who builds should enforce his system. I’m talking about the main contractor… Who is deploying the most resource on the site? The main contractor. So by logic, who is more capable of leading the communication and management system?”
“The project control manager of the contractor didn’t change any fact. He never lied. He never manipulated the data. He just put the information in the context that changed the whole narrative.”Ahmed Abdelfattah · 1:04:27
The same three months of data, presented two ways in a monthly progress meeting where the contractor sits in the defensive chair.
The snapshot: “SPI is 0.8”
- One number, no context
- Below plan for three or four months
- “A huge wave of criticism and argument from the project owner and the consultant”
The trend: 0.65 → 0.7 → 0.8
- Three months of improvement on screen
- The smarter version projects forward until SPI reaches 1
- The meeting becomes “an optimistic review of the performance”
“Did King Khufu use Power BI? Did he use Primavera? Did he use communication techniques? No. So if these tools, which are good tools by the way, excellent tools, if they don’t save money or time, then what is the purpose?”Ahmed Abdelfattah · 1:08:06
- “Have a realistic plan. A really realistic plan. And by the way, detailed plan is not a realistic one.” 57:25
- “It depends on the side from which you look at the elephant”: the contractor usually sits on the defensive chair. 1:02:22
- “I love to make a report like a movie… how will you tell the story, from which side?” 1:05:22
- AI: “good for analysis… good for showing the whole scenarios,” but “I see AI more as a tool. Not a full replacement to human judgment.” 1:06:59
- The takeaway, in one image: “We waste wood that can build a bridge to build a boat instead.” 1:07:47
- Orion closes with the Gateway Arch in St. Louis, built in the 1960s, its PERT-era work plans on display beneath it. The cost he cites is from memory, so treat it as directional. 1:08:52
- “Project management now is an industry itself. It’s not a construction-related industry.” 1:09:50
The Big Ideas
Four ideas carry the episode. Sketched here the way a controls room would whiteboard them; the third uses one of Ahmed’s own dashboards as the drawing.
More roles, more tools, more data, and in his observation a less efficient process, because the department optimizes itself instead of the project.
2008 · One planner, P3
- One planner (maybe two) per project
- Primavera P3, the only main tool
- A direct line to the project manager’s decision
- The schedule seen as “a wonder of the project”
Now · The five-role department
- Scheduler, planner, controls manager, risk manager, reporting manager
- Focused “on the process itself”
- “A separate business other than the project management”
- His verdict: “less efficient than in the past”
What the document is for decides everything about it. Confusing the two is how a controls team polishes 60 pages nobody reads while the executive asks for one hand-built report.
Project records
- Daily, weekly, monthly: the contract record
- Drawings, approvals, claims, change orders, instructions
- Systematic, so month compares to month
- “Nobody reads it, but it’s still important”
Decision reports
- Executive, scenario and focus reports
- No template, ever
- Built on the reader’s time, purpose, background, even insecurities
- A story that ends with a conclusion
A roadside poster gives a driver five seconds: one big sandwich, one big price. A decision report gets the same treatment, and his own overall-progress dashboard shows how.
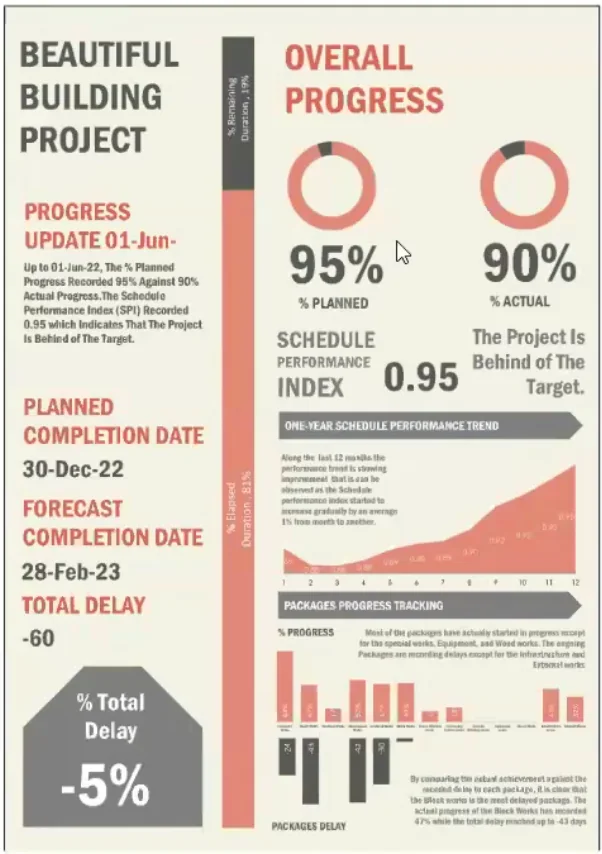
- The hero: what this client cares about most. Percent planned against percent actual, in the biggest type on the page. “I look at what my client would be more concerned about. I put it as a hero.” companion · 20:22
- The second hero: the consequence. Planned completion date, forecast completion date and total delay, the numbers that trigger the decision.
- The fine print. The SPI, its one-year trend and package-by-package progress, smaller, there when someone asks.
- The rule behind it. “Your hero: the issue in the focus. Then comes the decision you need to make. Other details… should become a sub.” 42:45
A count of open and closed risks helps nobody decide anything. The day-zero risk tool earns its place by turning a decision-maker’s idea into a simulated outcome with a stated confidence.
The Dashboard Tour
In the companion episode Ahmed shares his screen and walks through his published dashboards, oldest to newest, explaining the design choice behind each. All eleven are his own work, captured from the video; each timestamp jumps to that moment in the companion on YouTube, and each image opens full size. He started during COVID, when he “was the only guy on the site” and had time to experiment: “I created like 1,000 dashboards just to publish like 100.” companion · 9:46
“There are 13 core graphic design principles: alignment, contrast, balance, hierarchy, color, white space, proportions, repetition, rhythm, movement, emphasis, proximity, and unity.” companion · 10:21 He read about the concepts after years of trial and error; Orion points listeners to Figma’s guide to graphic design principles.
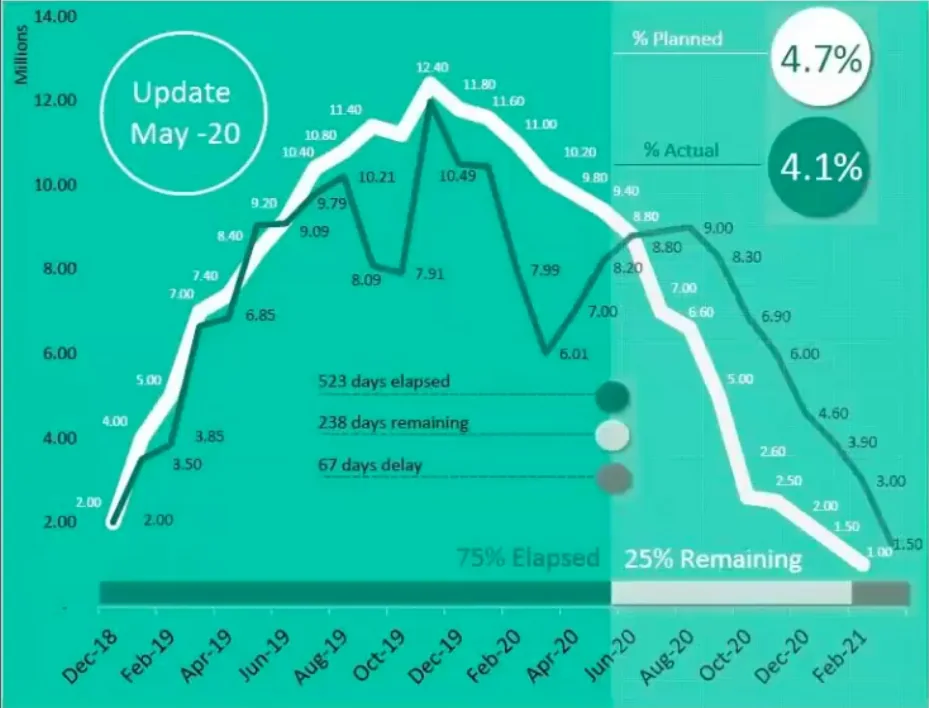
Monthly progress against the baseline
A May 2020 update: the planned curve as a bold white line, the actual in green, and the forecast months shaded so actuals and forecast never blur. Orion asks where the shading trick came from.
“They are concerned about the planned versus actual. So I put this in a different color… If I make the planned a more bold line, it will be better because it will differentiate from the green line. Now you will have the variance.”Contrast · trial and error
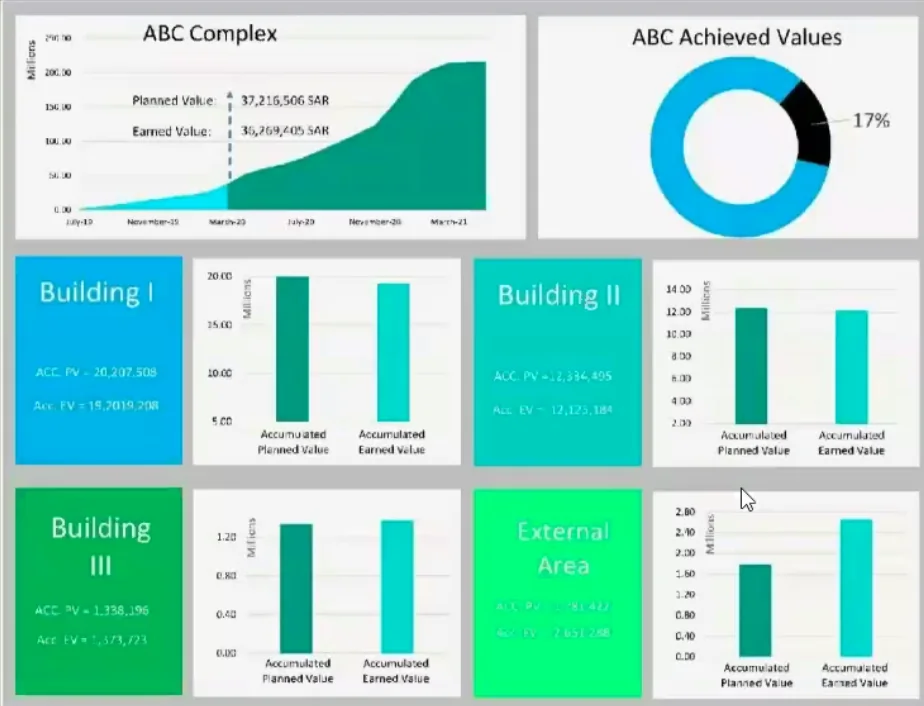
Achieved values, building by building
Earned against planned value for a four-building complex, each building its own card in the same shape and palette.
“People, when they prepare a project control dashboard, the least thing they care about is the colors… It’s like a kiosk. Consider a dashboard is like your clothing. In the morning, will you wear a red T-shirt with blue pants?”Color · repetition
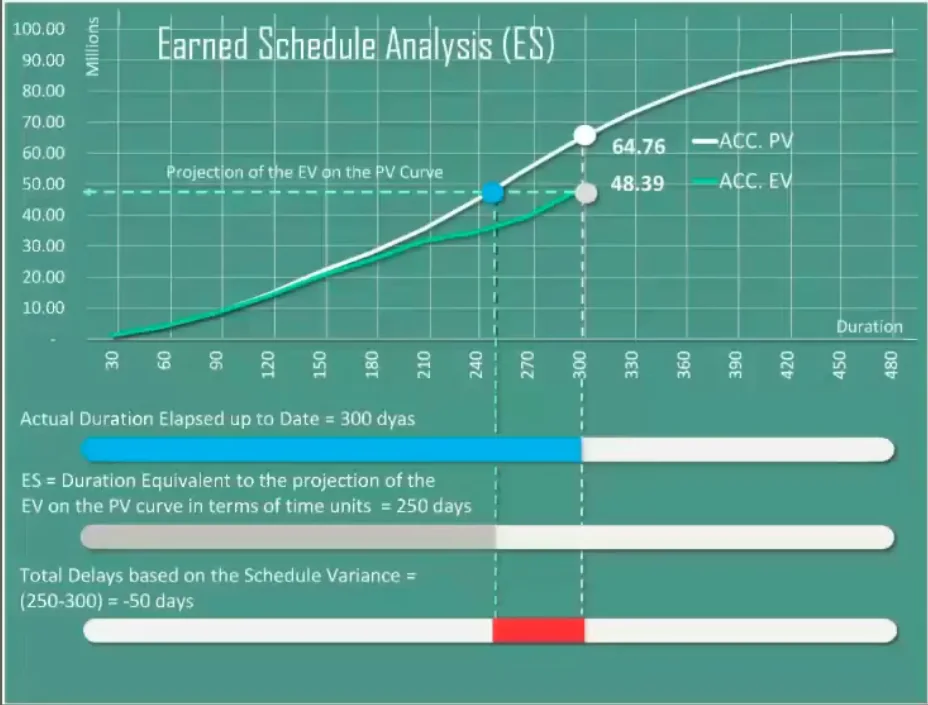
Earned schedule analysis, explained in one picture
How earned schedule measures delay by performance: project the earned value onto the planned-value curve, read off the time it represents, and compare it with time elapsed. 210 likes, 49 comments and 28 reposts, by his count.
“You’ll find the planned duration in gray, the actual duration in blue, and then you will find the red duration, which is the delay… You may now understand the whole concept of earned schedule analysis, because I just made it in contrast.”Contrast
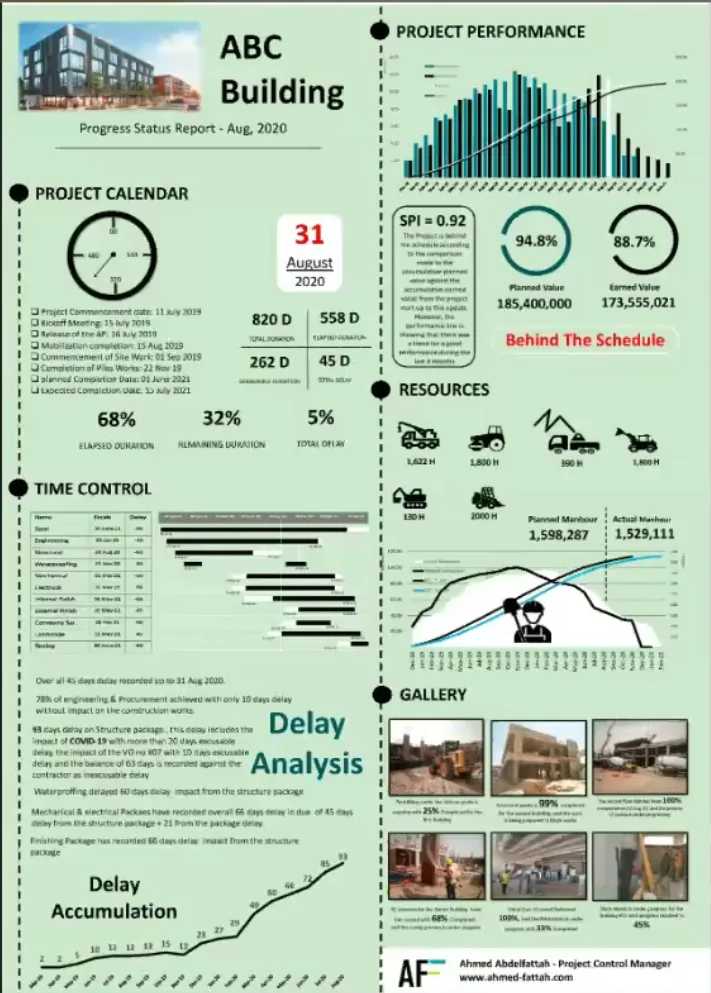
The progress report as an infographic
A month-end progress status report laid out like a newspaper page: calendar, performance, resources, time control, delay analysis and a site gallery. “The huge one,” by his count: 1,723 likes, 305 comments and 82 reposts.
“It is like a newspaper or something, like a portrait for the project… And by the way, this dashboard got me the whole attention in Saudi Arabia.”Infographic
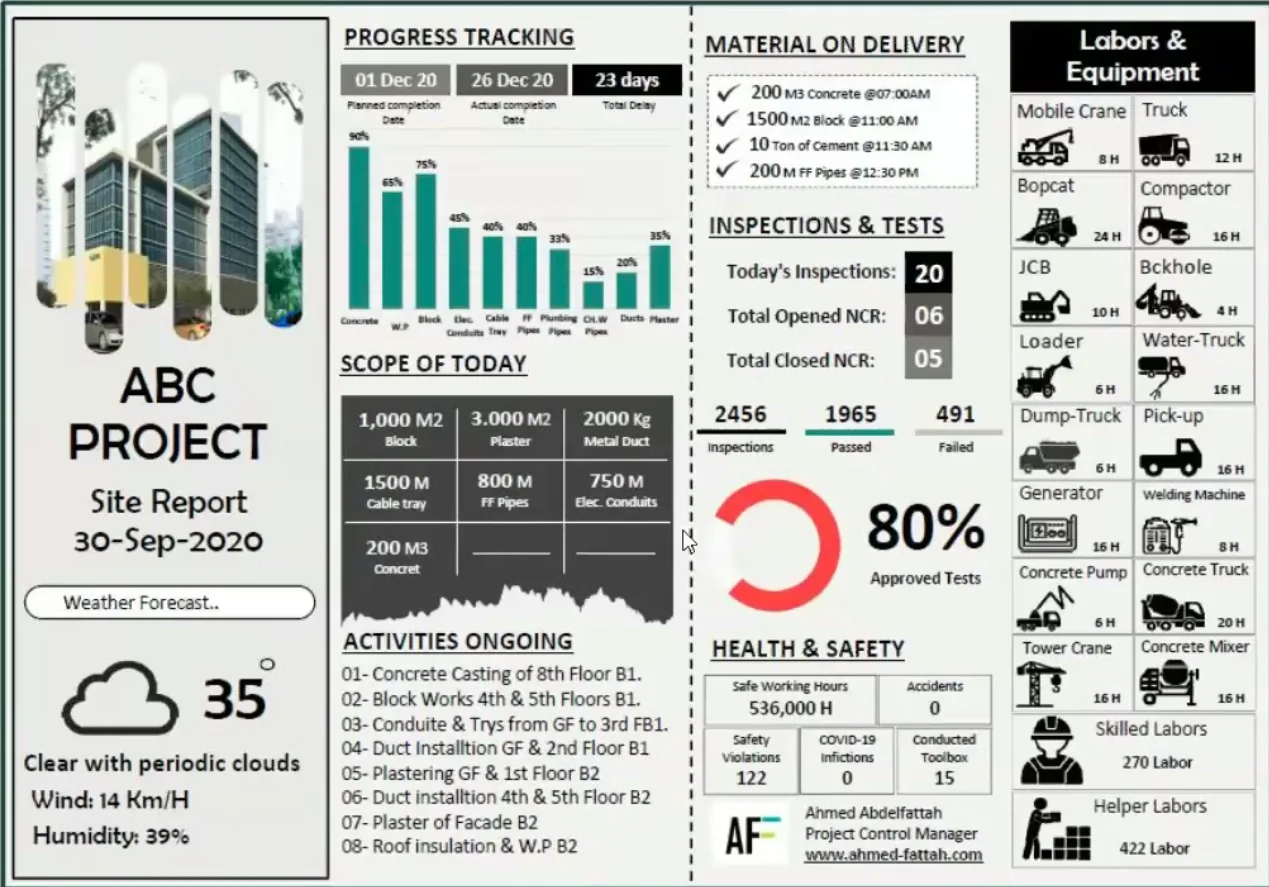
A site report built like a phone screen
The left column borrows from a phone’s lock screen (date, weather, a picture of the project); the sections run progress, today’s scope, activities, deliveries, inspections, safety, and labor and equipment as icons.
“I got inspired in the left side one by the mobile screen… You are looking at the weather, you see the date and there are pictures. Of course, you may put your son, your daughter, but here I love the project, so I put the pictures of the project.”Hierarchy
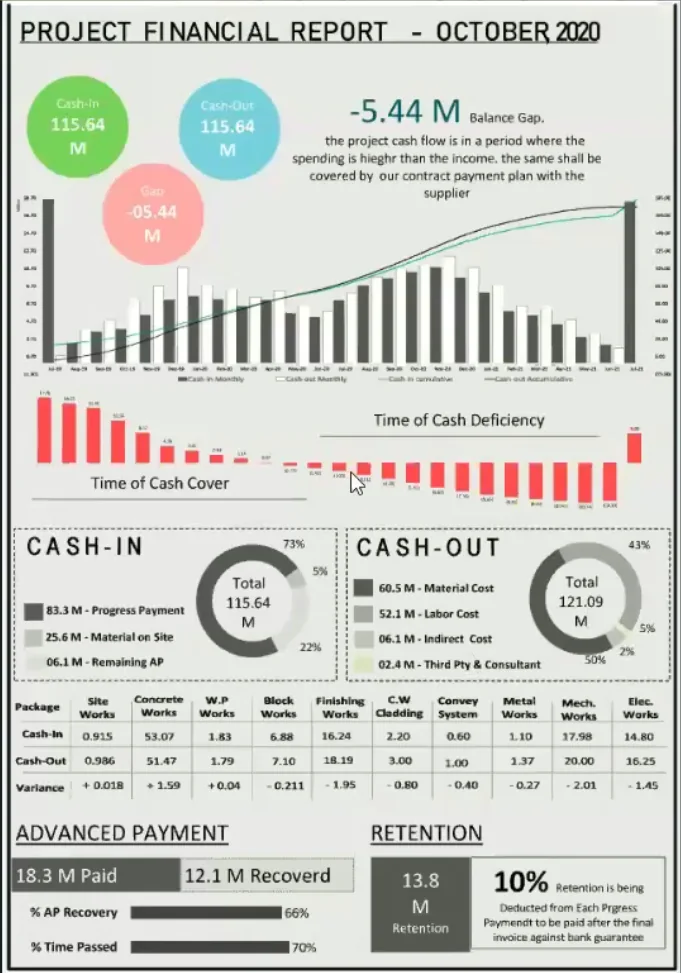
Cash flow, styled like a banknote
A project financial report in the grays of paper money, with the cash-flow curve as the hero and the months of cash deficiency set in red so the project manager can see exactly when to act.
“I have a story here to tell, and I got inspired by something real in the world… I make the alignment. I make the color. I care about it. I love it.”Alignment · story
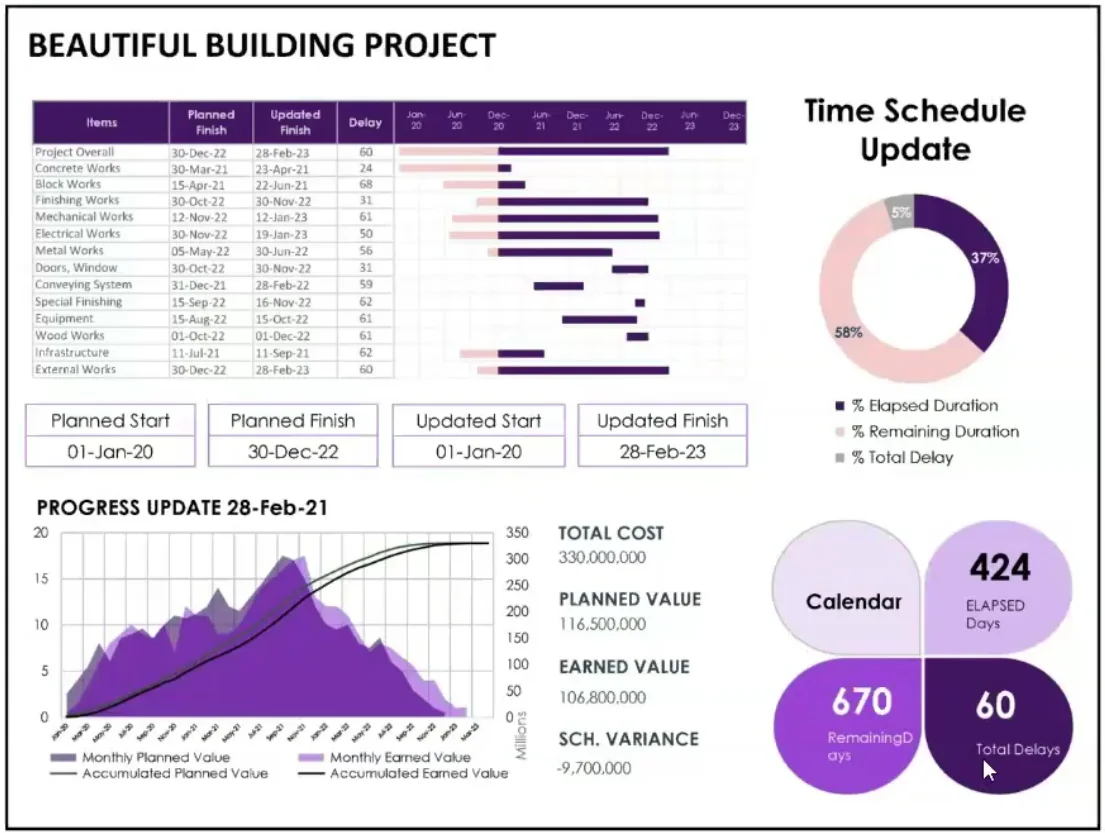
The schedule update that answers the instant question
A time-schedule update with package bars, the calendar quadrants and a progress S-curve, with total cost, planned value and earned value in plain type beside the chart.
“If I’m sitting in the meeting, I will get an instant question. “Ahmed, what is the total cost?” Here, three hundred and thirty million. What is the planned value up to now? It’s here, one hundred and sixteen.”Emphasis
Overall progress: one hero, then a second
An infographic table built around the single number this client cared about (percent complete), with the completion dates and total delay as a second hero and everything else in smaller type.
“I look at what my client would be more concerned about. I put it as a hero… And of course, I put here a second hero, which is planned completion date, forecast completion date, and total delay.”The hero
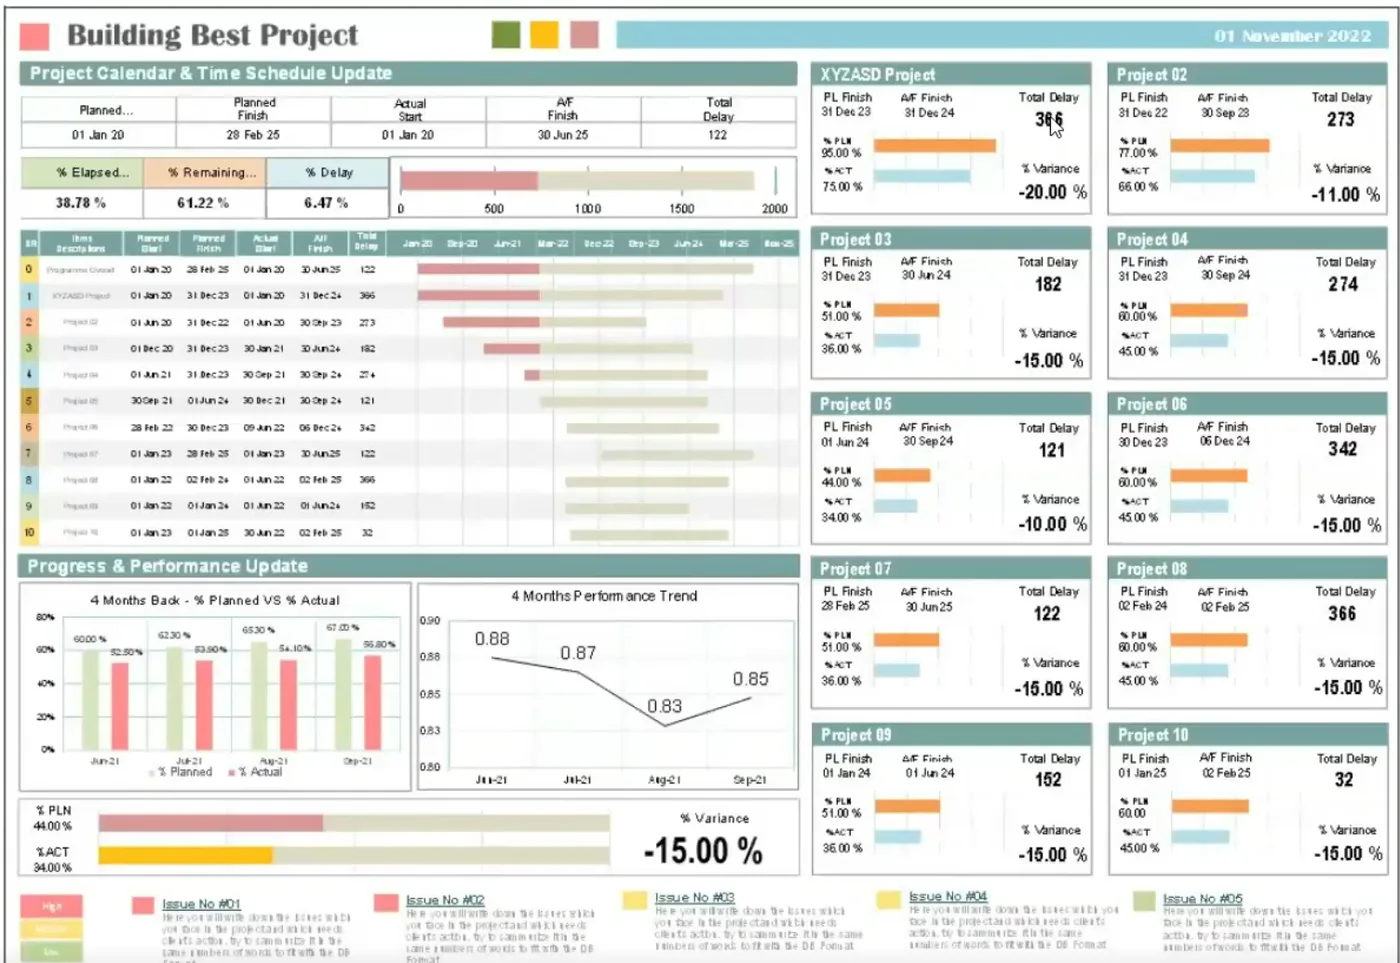
Ten projects, one page: the portfolio view
Built at the request of a portfolio manager in Qatar who needed one dashboard for a weekly client meeting: a card per project, the top five issues color-coded by urgency, a cut line showing time elapsed against time remaining, and performance drawn as a trend instead of an index.
“He will not know what SPI 0.85, what SPI 0.83 means. But if I characterize the performance in a line like that, he will get to know… This kind of dashboard already gathers most of my philosophy about the dashboard: how the dashboard will create a decision.”Decision-driven
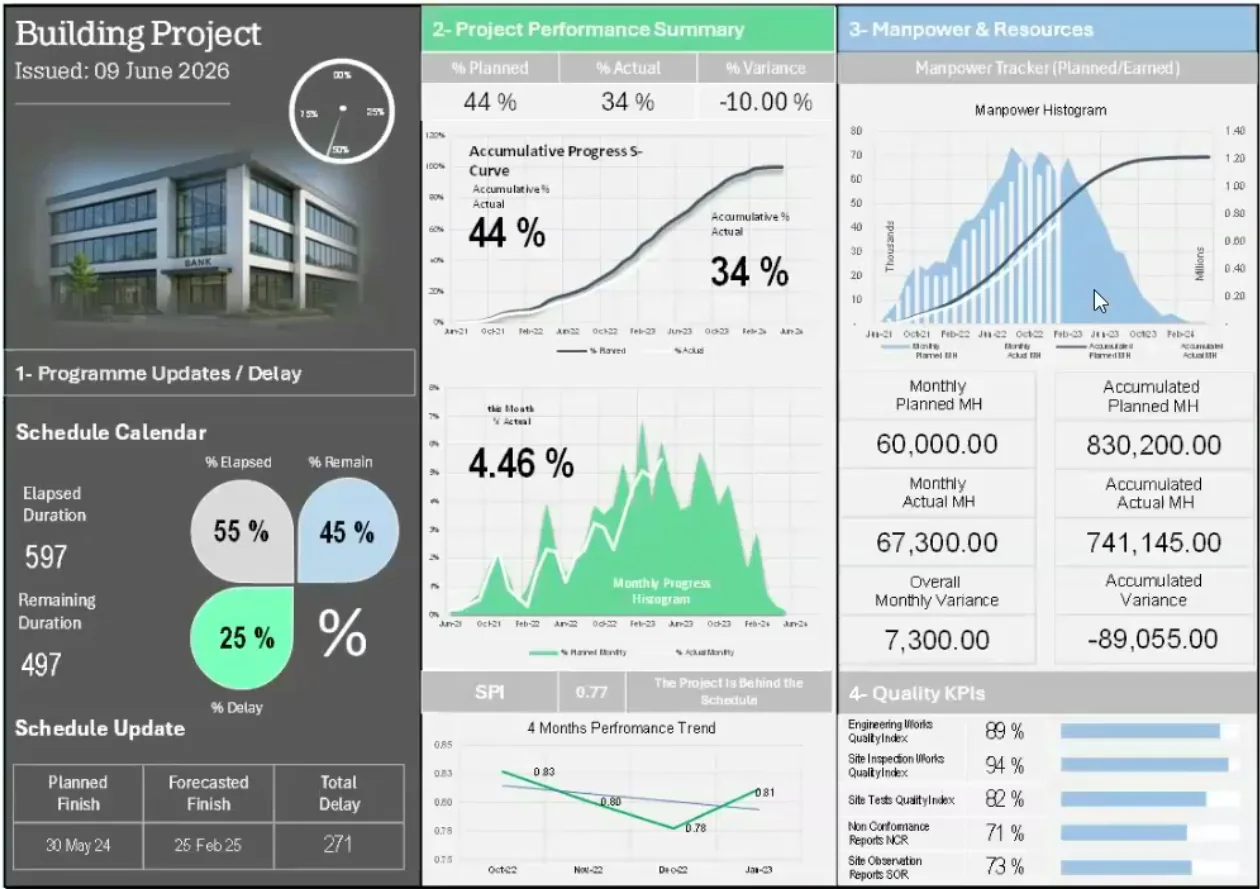
The weekly performance dashboard
His latest: schedule, delay and calendar up top, then a performance summary, this month’s progress, a four-month performance trend, the manpower histogram and quality KPIs, every number easy to reach.
“It’s easy now to see that there is like forty-four against thirty-four. How much time do you take to know this information?… This is suitable for a project control weekly meeting, just to show the information, and we can discuss based on that.”Audience fit
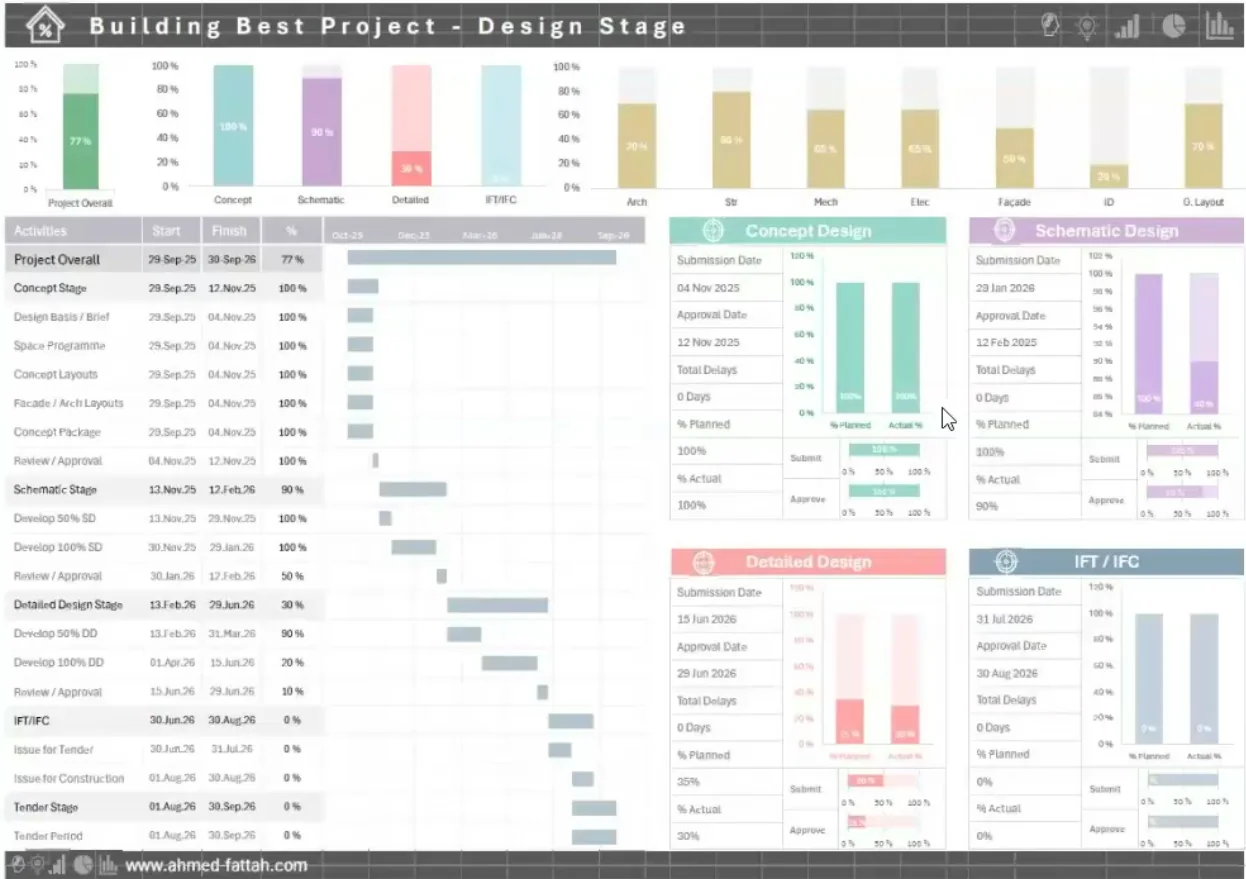
The design stage, where projects are born
A design-stage dashboard: progress by phase (concept, schematic, detailed, IFT/IFC) and by discipline, a card per phase with submission and approval dates, and a summary schedule.
“The project is born in the design stage, and the issues of the project are born during the design stage… If I go to my client with two slides only, one for the issue and concern and one for this simple presentation of the project, it’s enough.”Two slides
Dashboards © Ahmed Abdelfattah, shown by him on the companion episode and published on his LinkedIn and ahmed-fattah.com. Project names and figures on them are sample data.
From the Companion Episode
Before the screen share, the companion opens with the advice round: for students worried about AI, for early-career controls engineers, and for anyone weighing a move abroad. Quotes are transcribed from the companion and lightly condensed; timestamps are approximate.
“All people will use AI, but not all people have passion about what they are doing, and this will make you special.”Ahmed Abdelfattah · companion · 0:47
Tools or the project first?
“Learn about the project first. However, the current job market is widely relying on skills now, to be honest. So my advice is: learn about tools to get a job, but learn about the project to be special in your field.”
companion · 1:21
From a small village
“I grew up in a small village in Egypt. I’m a village guy. And here I am, talking on a professional podcast organized in the USA and living in South Australia… I always say to myself, ‘Someone did it. You can do it.’”
companion · 1:40
Be hard to satisfy
“You have to have a high standard. Be hard to satisfy, like nothing is enough to fill your dream. And actually now I’m 20 years experience, still I haven’t fulfilled my dreams yet.”
companion · 2:18
Speak up in year one
“Do not be afraid to give your opinion, even if you are only one person sure about it. You have a golden opportunity to do mistakes in your beginning without getting a huge judgment from your supervisor or from your manager.”
companion · 3:23
Off the clock
Science, physics, history, and true crime, which he loves “from the perspective of analysis”: how investigators build the case and sort out the evidence. Orion’s read: reporting is storytelling, so study how stories work.
companion · 4:51
Dashboards as movies
“I look at the dashboard like a movie or like a show… You need to have a hero. You need to have other characters to support your idea.”
companion · 5:38
“I’ve come from Egypt in a time where there was a revolution, and I am feeling myself now in a revolution against the construction industry.” companion · 30:54
Bookshelf & Links
What the episode and its companion point to: one tool named as the day-zero install, one design guide, Ahmed’s own work, and where to find the people and the show.
Ahmed’s shelf
- The tool
- Oracle Primavera Risk Analysis · his if-I-could-go-back install, “or any other software like it.” 26:41
- The design guide
- Figma: graphic design principles · the 13 principles he checks every dashboard against. companion · 10:21
- His work
- ahmed-fattah.com · templates, dashboards and his blog.
- The mega-development
- NEOM · the Saudi giga-project where one program’s management team ran to about 500 people. 21:47
- Host reference
- The Gateway Arch, St. Louis: Orion’s closing exhibit for what 1960s planning could deliver without today’s tooling. 1:08:52
The episode
- Listen
- Episode page (Podbean) · Apple Podcasts · Spotify
- Companion
- “What Decision-Driven Reporting Actually Looks Like” · the dashboard tour on YouTube (31 min)
- The guest
- Ahmed Abdelfattah on LinkedIn · ahmed-fattah.com
- The host
- Orion Matthews on LinkedIn · Queryon
- The show
- themajorprojectpodcast.com · new conversations from the people building projects over US$1 billion.
- The Bookshelf
- The Major Project Bookshelf · every recommendation from every episode, with the reasoning in the speakers’ own words.
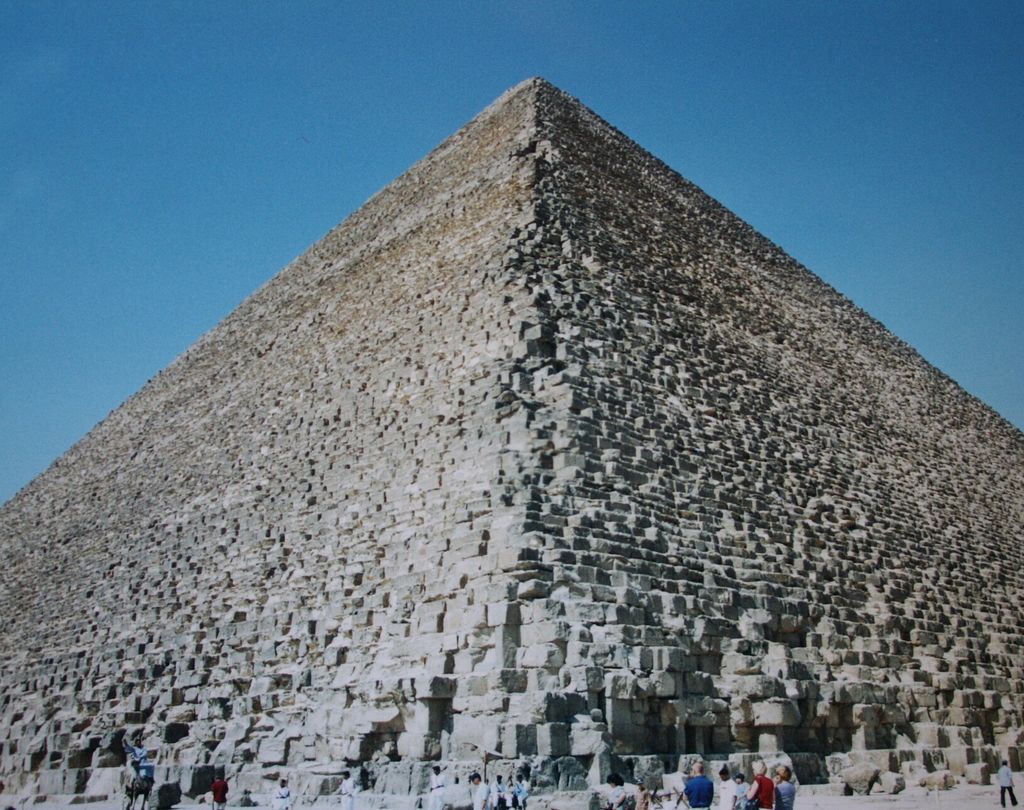
Banner photographs, the three stops of Ahmed’s career: the Great Pyramid of Khufu at Giza by Gary Todd (CC0); the Riyadh skyline with the King Abdullah Financial District and Kingdom Tower by B.alotaby; and Adelaide’s CBD across the River Torrens by Yu Chu Chin, both licensed CC BY-SA 4.0. All via Wikimedia Commons. Dashboards in the tour and Big Idea 3 © Ahmed Abdelfattah.
Quote Bank
The best on-the-record lines from the episode and its companion, gathered in one filterable place. “Highlight” marks the lines most worth scrubbing back for; quotes lightly condensed, timestamps keyed to the published videos and approximate.
The Efficiency Inversion 0:00–5:43
- “Let’s say that I was a bit lucky, because my first job was with a major contractor in Egypt and Africa, the Arab Contractors… The first project I worked on was worth around 200 million USD.”
- Highlight“It’s like comparing one apple to ten apples, but my observation is that the project control process has become less efficient than in the past.”
- Highlight“We are now competing ourselves to be the best in this discipline of project management rather than working to achieve the project completion date, the project quality, or the purpose of the project.”
“We Only Produce Reports” 5:43–14:00
- Highlight“We are not producing shop drawings… We are not supplying construction material or building something on the site. We only produce reports. And that is what we are paid for.”
- “I received so many calls, not only from recruiters but from vice presidents, directors and portfolio managers.”
- Highlight“When we are making decisions, no one was using this system… You have spent a million dollars or something on this system. So what’s the benefit of it, and why do you ask me to organize this chaos?”
- “After one or two months this tool turns out it’s just like a communication tool.”
Scenarios, Silos & the Site 14:00–25:31
- “The common thing among all of these special reports is that they help in making a decision, not only showing information.”
- Highlight“You put them in the same scene and boom, all is clear. You don’t need a lot to explain. Just visualize it.”
- “If your report or schedule is not reflecting the site condition, then it is useless.”
- Highlight“I realized that no one cares about the project completion rather than his own work.”
- “Enough is enough. Direction only will come from me. Anyone who needs to do any change must come to me first.”
- “Just put the risk issues and required decisions, and you will find them 100% listening to you.”
Day Zero: Risk Before Everything 25:31–34:12
- Highlight“One word. Risk analysis tool. You have to involve risk from day zero, not from day one.”
- “90% of my time is just preparing scenarios for the decision-makers to make decisions.”
- “How sure am I that on January 1 there will be 60 people coming to the building, which is not built yet, to floor 26, which is not there yet, to install lighting fixtures which are not selected yet?”
- “If there is planning without risk management, it is nothing. We are just doing process.”
- Highlight“Risk is not visualized. Risk turns into a decision.”
Two Reports, One Hero 34:12–48:12
- “A project director holding a decision over one or two billion dollars is acting literally like a CEO.”
- “Instead of “monthly reports,” we can call them “monthly records” or “weekly records.””
- “There is no template. Template does not work with this. AI or any management tool will struggle to find a place, because this is built on how the other person will perceive the information.”
- “You need to know his time limitation, his purpose, his background, and even his insecurities.”
- Highlight“Your hero: the issue in the focus. Then comes the decision you need to make. Other details may be important to show, but they should become a sub.”
- Highlight“Executives in the meeting room make their decisions based on their trust in the person who gathered the data and sorted it out into information.”
Entropy: When the Process Outruns the Site 48:12–57:22
- “How much do we take just to communicate the information? At least three days.”
- Highlight“We say the project is delayed because of a lack of resources or bad performance or unqualified engineering staff, but we never say insufficient management system.”
- “It’s true that nobody reads it, but it’s still important… We can call them not reports. We can call them project records.”
- “I am happy to do so, but I am afraid I’m not willing to spend the rest of my life in jail.”
Minimum Viable Controls & the Khufu Question 57:22–1:10:26
- Highlight“A detailed plan shouldn’t exceed a three-month look-ahead.”
- “The soldiers are already suffering… But the leaders say, “Ah, we are winning here.” So which one should I believe?”
- “The one who builds should enforce his system… The whole project management process must be a contractor thing.”
- Highlight“He never lied. He never manipulated the data. He just put the information in the context that changed the whole narrative.”
- “I see AI more as a tool. Not a full replacement to human judgment, especially when it comes to making decisions.”
- Highlight“In the construction industry, we waste a lot of resources. Like we waste wood that can build a bridge to build a boat instead.”
Companion · Advice companion · 0:00–6:29
- Highlight“All people will use AI, but not all people have passion about what they are doing, and this will make you special.”
- Highlight“Learn about tools to get a job, but learn about the project to be special in your field.”
- “Do not be afraid to give your opinion, even if you are only one person sure about it.”
Companion · The Dashboard Tour companion · 6:29–31:25
- “People, when they prepare a project control dashboard, the least thing they care about is the colors… Consider a dashboard is like your clothing.”
- “You may now understand the whole concept of earned schedule analysis, because I just made it in contrast.”
- Highlight“This kind of dashboard already gathers most of my philosophy about the dashboard: how the dashboard will create a decision.”
- “The project is born in the design stage, and the issues of the project are born during the design stage.”