



PodBOK brings industry guidance together with real-world experience from major projects. Use it to inform your approach, and check the facts and requirements that apply to your project.
101: start with the reader and the decision
Use the Data guide first if your team cannot explain where a number came from, what it means or which period it describes. Then define the job this report must do. A contractor progress review, an executive funding decision and an operational handover need different views of the same project.
Write a short reporting brief before opening the dashboard tool: who will read it, what they already know, the question they need answered, when they need the answer and what action is available. Agree the required detail with that audience. Preserve the contractual record while giving decision makers a focused explanation they can use.
- Name the decision owner and the meeting or deadline the report supports.
- State the reporting period, comparison basis and any material information gaps.
- Ask which decision would change if the result were different. Remove measures that serve no defined purpose.
Implementation: build the reporting calendar backward
Begin with the decision meeting and report issue date, then work backward through approval, corrections, reconciliation and source submissions. Agree the reporting boundary and time zone with contractors and internal teams. A calendar that gives the last contributor the same deadline as the report author leaves no room to check the combined story.
Scroll sideways or use the arrow keys to see all columns.
| Milestone | Example timing | What must be clear |
|---|---|---|
| Status cutoff | 31 December, 23:59 UTC | The measurement boundary for December; map local source cutoffs explicitly. |
| Source submissions | By 3 January | Owners submit December data and identify gaps, estimates and source dates. |
| Harvest, review and correction | 4-5 January | Reconcile the combined data and return discrepancies to source owners. |
| Approval and period lock | 6 January | Approve a named version and its exceptions; preserve the issued data basis. |
| Report issue | 8 January | Publish the December report with its cutoff, version and issue date. |
| Decision meeting | 9 January | Allow reading time and record decisions, owners and next actions. |
Adapt the dates for actual working calendars, holidays, time zones, contract obligations and available review time. Assign an owner to every handoff and a route for late submissions. The issue date does not change the performance period: a December report published in January is still a December report.
Orion Matthews and Tonya White's harvest process adds a practical rhythm: collect, review the reports, correct the inputs and repeat before the final reporting position is locked. Plan those rounds into the calendar. The Data guide explains the identifiers, ownership and snapshots behind them.
Align the dates before comparing the numbers
Keep the source status date separate from the extraction time, dashboard refresh time, submission deadline, approval date and report issue date. A refresh this morning can still contain a schedule last statused a week ago. State the time zone where it affects the boundary and identify the dates beside the measures that depend on them.
Aim for compatible cost, schedule and physical-progress cutoffs. Where that is not possible, show each source date and explain the gap. An agreed accrual, estimate or reconciliation may help bridge it, but label the adjustment and assign an owner. Changing the date label does not align the underlying information.
- Compare planned value, earned value and actual cost on compatible scope and time bases; disclose unresolved timing differences.
- Distinguish period movement from cumulative values, and a genuine change from a correction to an earlier period.
- Name the baseline and forecast versions used in each comparison. A reporting snapshot does not by itself change the approved baseline.
- When later events materially affect the decision, add a clearly dated subsequent-events note instead of silently rewriting the period position.
Current view or December report? Make the difference visible
Use "current operational view" for information that changes as systems update, and "period-end snapshot" for information measured at a defined cutoff. Once approved and distributed, retain the "as-issued record" of what readers received. Reserve "real-time" for a view whose actual end-to-end delay supports the claim.
Scroll sideways or use the arrow keys to see all columns.
| Question | Current operational view | Period-end and as-issued view |
|---|---|---|
| What does it answer? | What is the latest available position for today's work? | What was the position at the cutoff, and what did we issue? |
| How does it change? | New source updates and refreshes may change the result. | An identified approved version stays stable; corrections create a traceable revision. |
| Which dates are visible? | Source status dates, last successful refresh and material delays. | Period cutoff, source dates, approval, issue date and version. |
| What can be provisional? | Unreviewed inputs may appear if clearly labelled and appropriate for the decision. | Any accepted estimates or exceptions remain explicit in the approved record. |
| What must the reader avoid? | Assuming every source is current because the screen refreshed. | Assuming a closed snapshot is correct merely because it is locked. |
For example, a January dashboard may show a revised delivery forecast after December has closed. That is useful current information. The December as-issued report should still reproduce the forecast and evidence used at its approval. If December itself needs correction, distinguish the corrected edition from the original and explain why.
Carry the view type, cutoff and version into exports, screenshots and meeting packs. Keep current and approved-period filters clearly separate. A live source blended into a supposedly locked report defeats the distinction, even when the headline still says "December".
Implementation: build a story the evidence supports
Start with the important change, explain its consequence, then show the available response. A useful sequence is: what changed, why it matters, what we know, what remains uncertain and what decision is needed. Separate an observed movement from a proposed explanation. A persuasive narrative should make uncertainty easier to see.
In a hypothetical package report, a delivery forecast moving beyond the required installation date calls for more than a red status. Show the affected milestone, evidence behind the forecast and the choices the project can still make. Give each proposed action an owner and a decision date.
Lessons from the field: trust is earned through people
Earn that trust by being able to explain the evidence behind the headline. Know the source, the review performed and the unresolved limitation. Make it easy for someone to challenge a conclusion without having to reconstruct the whole report.
When a number changes after publication, explain the correction and its effect on the earlier conclusion. Keep the previous reporting position identifiable. Credibility grows through consistent, candid reporting, including occasions when the evidence does not yet justify an answer.
Treat a report edit as a controlled change too. If someone adjusts a figure or conclusion after generating the report, reconcile it to the approved dataset or record the explicit adjustment and its approval. On reissue, identify affected recipients, dashboards and exports so the corrected story reaches the people using it.
Implementation: make style serve understanding
Create a short style guide for the reporting team. Agree the vocabulary, chart conventions and visual hierarchy so readers can spend their attention on the project. Consistency should help them interpret the message, while the page structure can adapt to the decision.
Design for attention, then allow time to understand
A reader may notice a red bar or a widening gap quickly. They still need to understand the scope, comparison, cause, uncertainty and available response. Design the report to guide that work. A page full of visible information does not establish that its audience has understood the decision.
In these studies, bits describe information under a defined task and encoding. They are not a count of thoughts or items on a dashboard. The useful question for a reporting team is what the reader can interpret and act on, not how much information the screen can display.
For reporting, treat attention as a resource to spend deliberately. Make the priority easy to find, reduce unnecessary interpretation and leave time to question the conclusion. Keep the supporting evidence available, including exceptions that could change the decision.
- Give the view a clear job. State the finding in the headline and identify the question the audience needs to resolve.
- Reduce competing signals. Remove decorative elements and redundant measures; retain dates, units, comparison bases and material uncertainty.
- Make the comparison easy to follow. Keep scales and layouts consistent where appropriate, label the relevant values directly and use emphasis selectively. Explain any change of scale.
- Sequence the explanation. Orient readers to the scope and period, show the change, explain its consequence, then discuss the options. Keep earlier comparisons available rather than making people remember a vanished chart.
- Give people time to read. Introduce a new visual, pause and check its meaning before adding another claim. Avoid automatic slide advances or dashboard refreshes that change the evidence during discussion.
- Put detail within reach. Use a stable overview with supporting pages or drill-downs for investigation. Simplification must not conceal a contradictory result or remove the basis for challenge.
For example, an equipment-delivery report could first show the forecast delivery date against the installation need date. Then explain the affected milestone, show the evidence and uncertainty, and compare the available responses. Share the detailed package list for investigation. Do not ask the room to interpret every package while you explain a different problem.
Test the report with someone from its intended audience. Ask them to explain the main change, the period it describes, the uncertainty and the decision needed. Where they struggle, revise the explanation or layout and test again. Set meeting pace from that feedback and the decision's complexity.
Ahmed's billboard analogy makes the point memorable: give the reader a clear visual priority.
Lessons from the field: three designs, three choices
Ahmed's companion episode walks through the decisions behind his dashboard designs. These existing examples use sample project names and figures. Study the communication choice, then adapt it to your own audience and evidence. The written explanations carry the lesson; open each image for its finer detail.
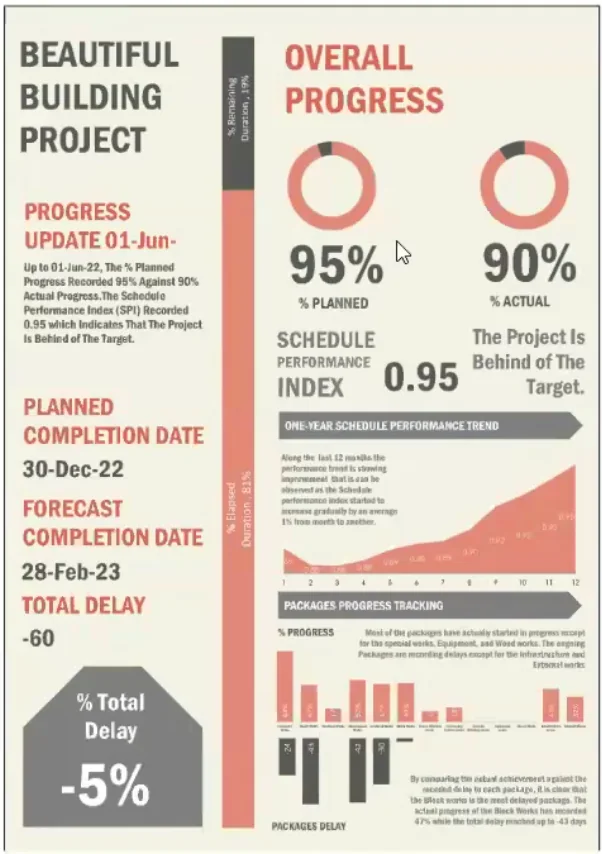
Choose the reader's first question. Planned versus actual progress takes priority; completion dates and delay show the consequence. Supporting measures remain available below.
Dashboard © Ahmed Abdelfattah. Project names and figures are sample data.
Explore this design in the episode brief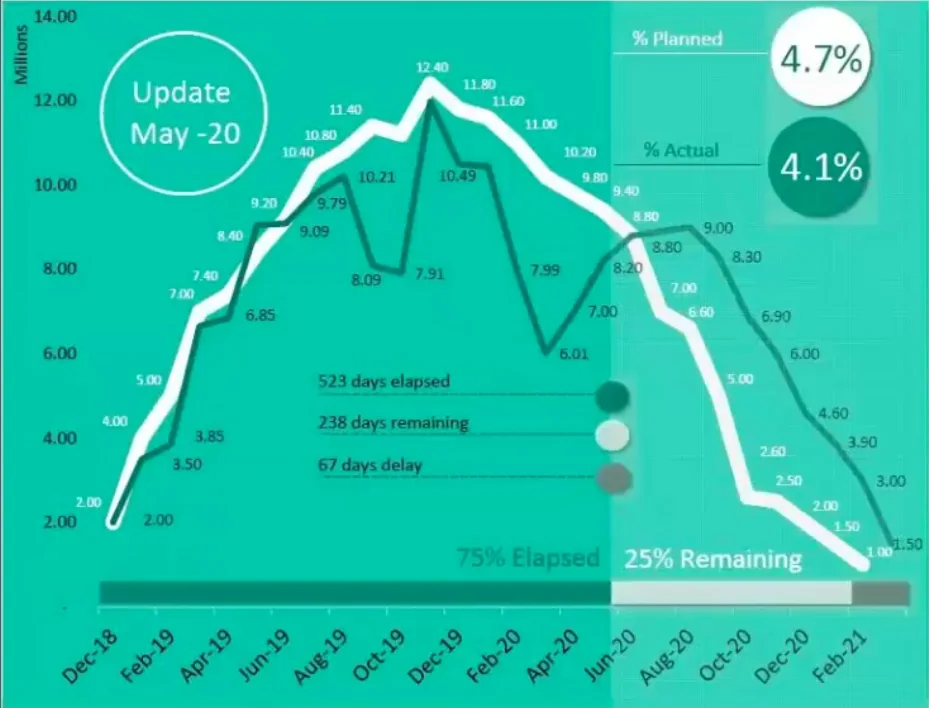
Make the comparison visible. Different line weights and colours draw attention to planned versus actual performance. In your own report, also make the legend, cutoff and forecast treatment explicit.
Dashboard © Ahmed Abdelfattah. Project names and figures are sample data.
Explore this design in the episode brief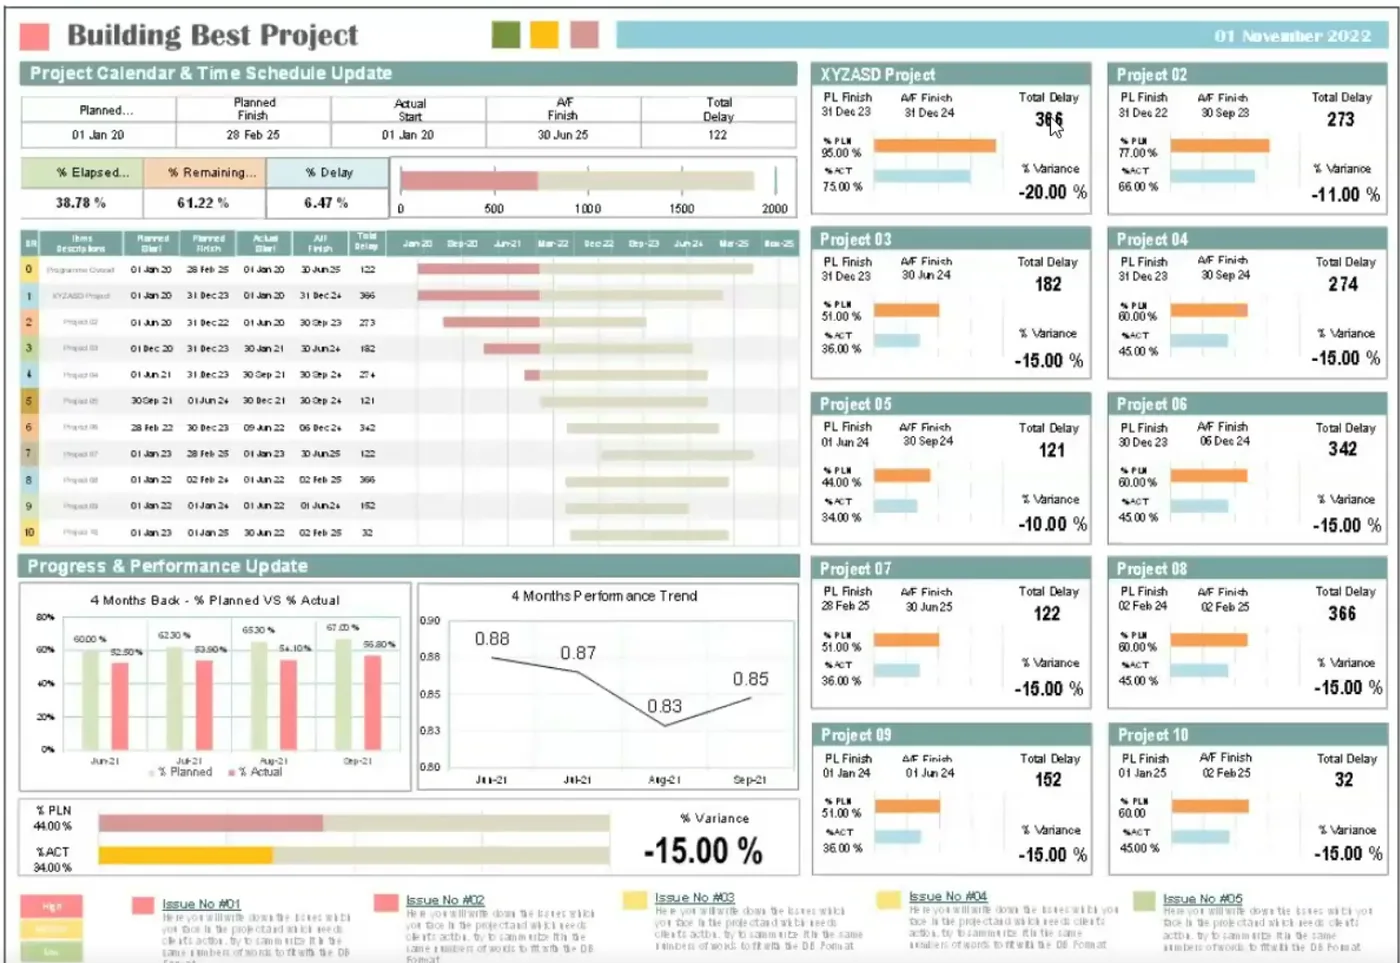
Design for the discussion. Repeated project cards support comparison, trends show movement and the issue strip focuses attention on matters that need a decision.
Dashboard © Ahmed Abdelfattah. Project names and figures are sample data.
Explore this design in the episode briefAdvanced practice: close the loop after the meeting
Record the decision, its basis, the action owner and the next review point. At the next cycle, explain what happened as a result. A report has more value when the team can follow its findings into a changed plan, a resolved uncertainty or an explicit decision to hold course.
Review the reporting system itself. Which pages changed a discussion? Which questions still required a separate explanation? Which measures encouraged the wrong behaviour? Use that feedback to improve the report while preserving the underlying records and definitions needed for comparison.
This field guide's Bookshelf
Explore the sources behind this article and related reading from our Bookshelf.
Storytelling With Multiple Data Systems
Orion Matthews · Referenced by PodBOK
Why it's on the shelfThe presentation places reporting strategy, shared scope, contributor requirements, a reporting calendar and a harvest process before the technology. Its case approach connects source systems through a warehouse while treating validation, training and continuing improvement as part of the work.
Referenced in this field guide Implementation: build the reporting calendar backward.
Unlocking Project Success: Building Timely and Accurate Reporting for a Major Capital Project
Orion Matthews and Tonya White · Referenced by PodBOK
Why it's on the shelfThe presentation connects agreed scope, stakeholder needs, contractor requirements and reporting calendars with a common data model. Its harvest cycle collects data, reviews reports, makes corrections and repeats before locking the final dataset for historical comparison.
Referenced in this field guide Implementation: build the reporting calendar backward.
Schedule Assessment Guide: Best Practices for Project Schedules
U.S. Government Accountability Office · Referenced by PodBOK
Why it's on the shelfGAO distinguishes a schedule status date, also called its data date, from the date someone views or saves the file. The status date separates actual progress from remaining work. That distinction matters when a freshly refreshed dashboard contains an older schedule position.
Referenced in this field guide Align the dates before comparing the numbers.
The unbearable slowness of being: Why do we live at 10 bits/s?
Jieyu Zheng and Markus Meister, Caltech · Referenced by PodBOK
Why it's on the shelfThis perspective estimates information throughput in selected human tasks at roughly ten bits per second, contrasting it with much greater sensory capacity. It offers a way to examine the difference between receiving information and using it in an observable task.
Referenced in this field guide Design for attention, then allow time to understand.
The brain works at more than 10 bits per second
Britton A. Sauerbrei and J. Andrew Pruszynski · Referenced by PodBOK
Why it's on the shelfThis commentary challenges extending the ten-bits estimate to the entire nervous system. The authors distinguish high-level cognitive tasks from substantial unconscious sensorimotor processing that operates in parallel. It cautions against describing a task-based estimate as the speed of the whole brain.
Referenced in this field guide Design for attention, then allow time to understand.
Project Controls & Data Analytics in the Era of Industry 4.0
AACE International, Source magazine · Referenced by PodBOK
Why it's on the shelfThe authors connect analytical capability to organizational goals, data quality, governance and complementary skills. Their discussion links acquiring and preparing information with analysis and action, and encourages consistent records throughout project delivery.
Referenced in this field guide Advanced practice: close the loop after the meeting.
Books featured within this article:
Keep exploring
Bibliography
Explore the conversations, publications and reading behind this field guide.
Podcast conversations
-
Conversation with Tarun Gohel
Passages and links
-
Understand why this audience needs the information
Tarun Gohel
Gohel recalls a presentation that failed because he had not understood its context and audience. His experience presenting to executives and government leaders taught him to research the recipient, explain the project plainly and focus on the matters that person can act on.
-
-
Conversation with Jovita Stander
Passages and links
-
Make reporting cutoffs visible on a project calendar
Jovita Stander
Jovita Stander describes aligning reporting cutoffs on Green Riyadh and publishing a project calendar. A construction-team exception was known and taken into account because its information arrived from several project management consultants.
-
-
Conversation with Ahmed Abdelfattah
Passages and links
-
Build the report around its reader and conclusion
Ahmed Abdelfattah
Ahmed describes understanding the reader's time, purpose and background, then developing a report as a story that ends with a conclusion.
-
Trust is earned through people
Ahmed Abdelfattah
Ahmed argues that executives rely on their trust in the person who gathered and interpreted the information. He describes that trust developing through decisions and interactions over the course of a project.
-
Give the reader a clear issue and decision
Ahmed Abdelfattah
Abdelfattah uses a hypothetical roadside sandwich advertisement to explain visual priority: the subject draws attention, the price frames a choice and supporting details remain secondary. He applies the analogy to a report by putting its issue in focus and the required decision next. The five-second roadside example is an illustration, not a measured limit for understanding a project report.
-
-
Conversation with Ahmed Abdelfattah
Passages and links
-
Give the reader a deliberate visual language
Ahmed Abdelfattah
In the companion tour, Ahmed discusses learning graphic-design principles and paying attention to colour, contrast, alignment and hierarchy when presenting project information.
-
Put the client's main concern first
Ahmed Abdelfattah
Ahmed explains that his overall-progress design gives the client's main concern visual priority, followed by completion dates and delay, with other detail available in a supporting role.
-
Use contrast to explain the difference
Ahmed Abdelfattah
Ahmed describes selecting contrasting planned and actual curves so the reader can see the comparison that matters in a progress report.
-
Make the portfolio discussion easier to follow
Ahmed Abdelfattah
Ahmed explains using performance trends and visible issues to support the portfolio manager's discussion and request for a decision or direction.
-
Publications and further reading
-
Storytelling With Multiple Data Systems
Orion Matthews · Cited source
Publication details
Schedule Validator User Conference, 2025
Orion Matthews. Storytelling With Multiple Data Systems. Schedule Validator User Conference, 2025. Supplied presentation.
PDF pages 7-13, 17 and 19; reporting calendar and harvest process on page 10.
-
Unlocking Project Success: Building Timely and Accurate Reporting for a Major Capital Project
Orion Matthews and Tonya White · Cited source
Publication details
Project Control Summit presentation, 2023
Orion Matthews and Tonya White. Unlocking Project Success: Building Timely and Accurate Reporting for a Major Capital Project. Project Control Summit, 2023. Public recording linked from the presenter’s events page.
Slides 7-19 and 21-27; harvest-process animation on slide 17.
The presentation illustrates the reporting setup and harvest cycle. Its dashboard figures are randomized examples.
-
Schedule Assessment Guide: Best Practices for Project Schedules
U.S. Government Accountability Office · Cited source
Publication details
GAO-16-89G, December 2015
Best Practice 9, Statusing Progress, printed page 122 (PDF page 136).
-
The unbearable slowness of being: Why do we live at 10 bits/s?
Jieyu Zheng and Markus Meister, Caltech · Cited source
Publication details
Neuron 113(2), 192-204, 2025; published online December 17, 2024
Zheng and Meister. Neuron. DOI: 10.1016/j.neuron.2024.11.008.
Introduction; Table 1; The information capacity of the nervous system; Appendices A-B.
These task-based estimates depend on encoding and assumptions. Their extension to the whole brain is disputed, and they do not set a reading-time or chart-count limit for reports.
-
The brain works at more than 10 bits per second
Britton A. Sauerbrei and J. Andrew Pruszynski · Cited source
Publication details
Nature Neuroscience 28, 1365-1366, 2025; published June 13, 2025
Sauerbrei and Pruszynski. Nature Neuroscience. DOI: 10.1038/s41593-025-01997-0.
Standfirst and discussion of symbolic task outputs, sensorimotor control and the proposed inner/outer-brain division.
This is a scientific critique of the whole-brain interpretation, rather than an experiment on project reports.
-
Project Controls & Data Analytics in the Era of Industry 4.0
AACE International, Source magazine · Cited source
Publication details
April 2019 technical article
James E. Arrow, Arvid Markhus, Vijai Singh, Cesar Ramos and Stefan Bakker. Source, AACE International, April 2019, pp. 15-23.
Printed pp. 17-22, especially the data-science activities on p. 19; PDF pp. 19-24.
This is a technical article published in 2019, separate from AACE's standards and Recommended Practices. Its technology forecasts belong to that period.
From the knowledge library
The billboard hero
Original card context
From the conversation · the roadside poster (41:49) · “Your hero, there will be like the issue in the focus” (42:45) · the dashboard from the companion tour (companion · 20:22) · dashboard © Ahmed Abdelfattah
Source context
The attention studies use defined tasks and encodings. They do not establish a universal reading speed, equivalence between experts and novices, or a dashboard-design formula.
Ahmed Abdelfattah's five-second billboard example is an analogy, rather than a measured limit for reading a project report.
PodBOK · The Major Project Podcast
https://www.themajorprojectpodcast.com/podbok/reporting-major-projects · Updated 2026-11-01